Hi everyone! If you’re even considering purchasing or selling a lake home this year, I’ve compiled data from 2017, 2018, and 2019 which will help inform your decision and make the best choice for you and your family. Lake house real estate can be a tricky business, so it’s important to have a knowledgeable realtor to help you through the process and find the right time to buy or sell!
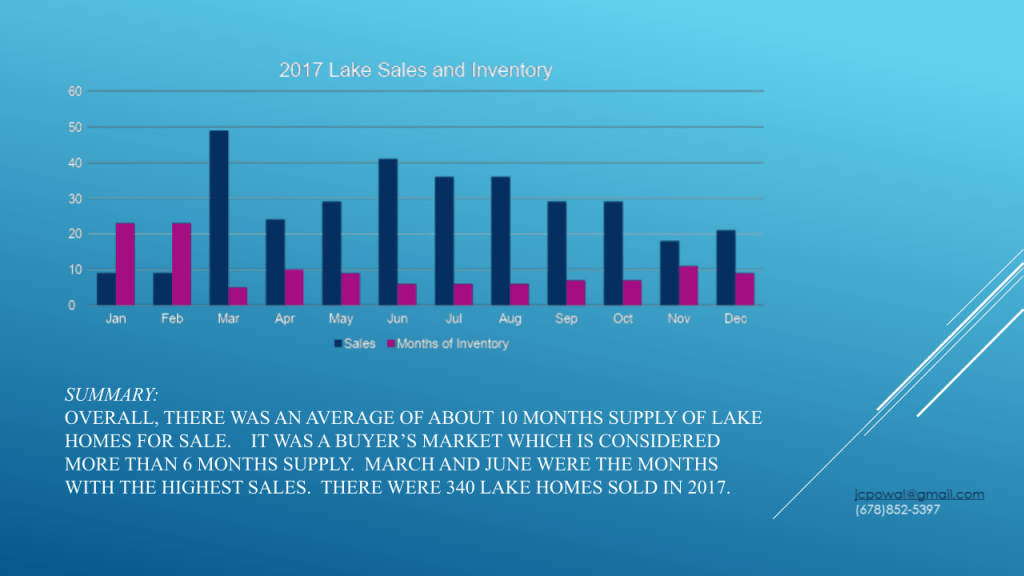
In 2017, you can see that there was an average of about 10 months supply of lake homes for sale. It was a buyer’s market, which is considered more than 6 months supply. March and June were the months with the highest sales. There were 340 lake homes sold in 2017.
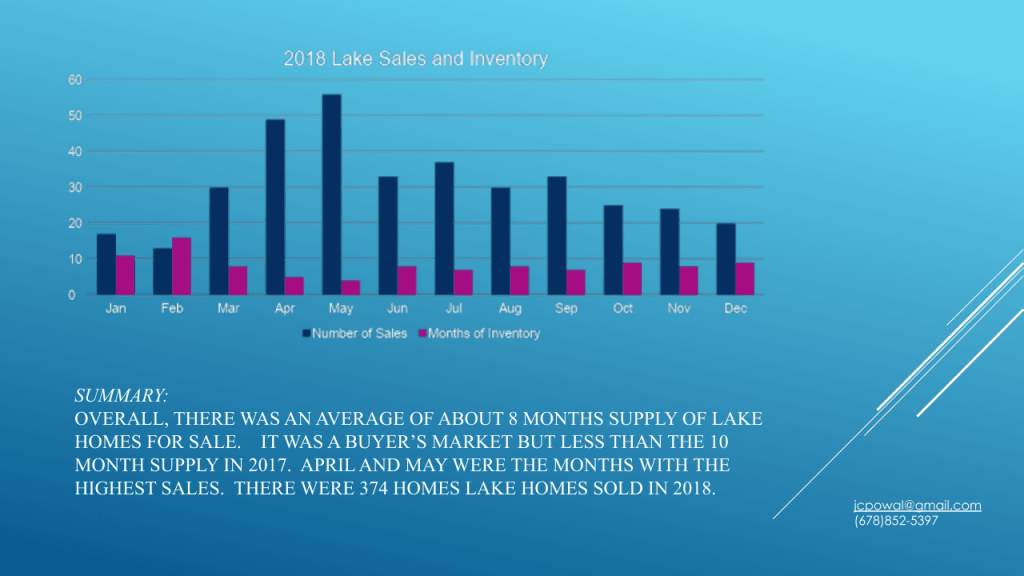
In 2018, there was an average of about 8 months supply of lake homes for sale. It was a buyer’s market but less than the 10 month supply in 2017. April and May were the months with the highest sales. There were 374 lake homes sold in 2018.
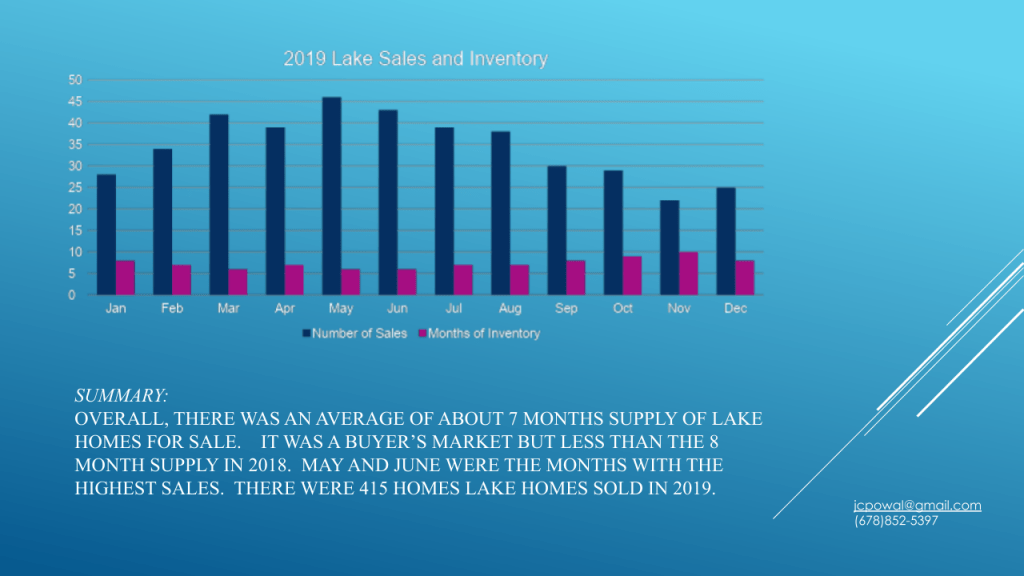
Moving into 2019, we saw an average of about 7 months supply of lake homes for sale. It was a buyer’s market but less than the 8 month supply of 2018. May and June were the months with the highest sales. There were 415 lake homes sold in 2019, an increase of 41 homes from 2018, or 11%.
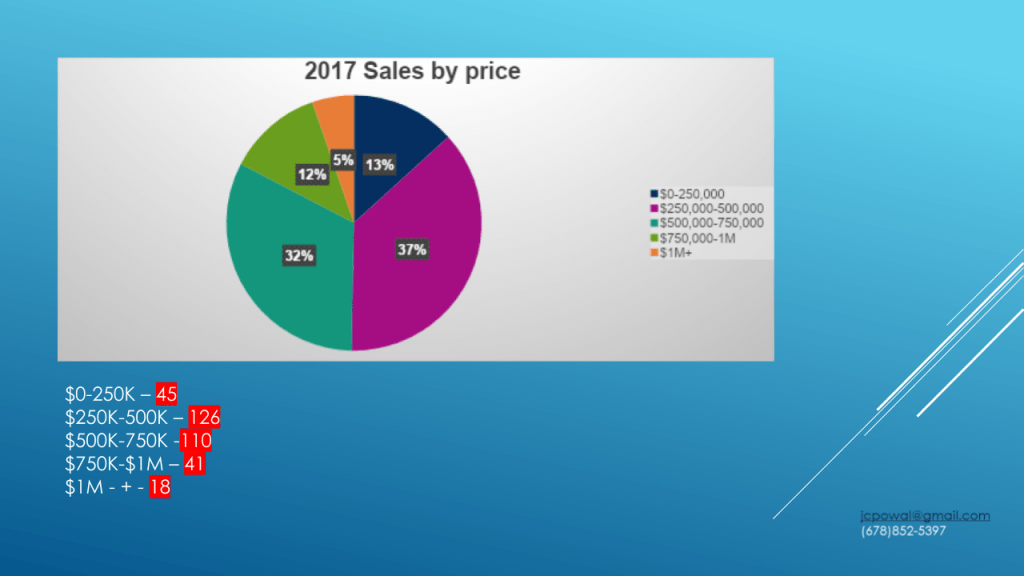
In 2017, lake sales slightly favored the $250k-500k range at 37%, though only slightly ahead of $500k-$750k homes coming in at 32%. Eighteen $1M + homes were sold, landing the highest range at %5 of all sales.

In 2018, $250k-$500k sales absorbed some of the $500k-$750k sales, moving them to 41% and 29% respectively. Meanwhile $1M+ home sales jumped to 8% from the previous year.
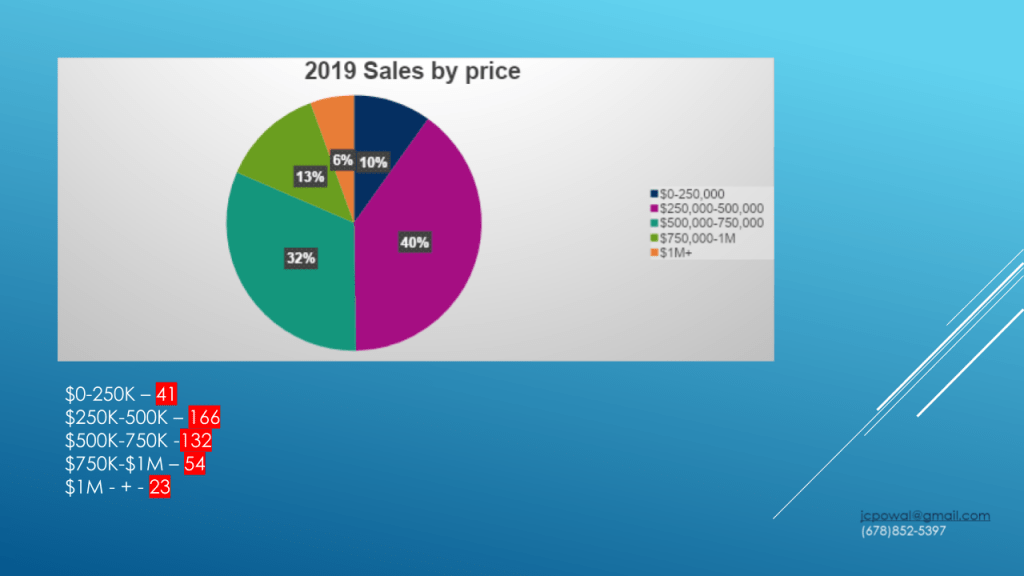
Last year in 2019, $250k-$500k homes held steady at 40%. $1M+ homes dropped slightly to 6%, bolstering an increase in sales in the $500k-$750K range which moved up to 32%.
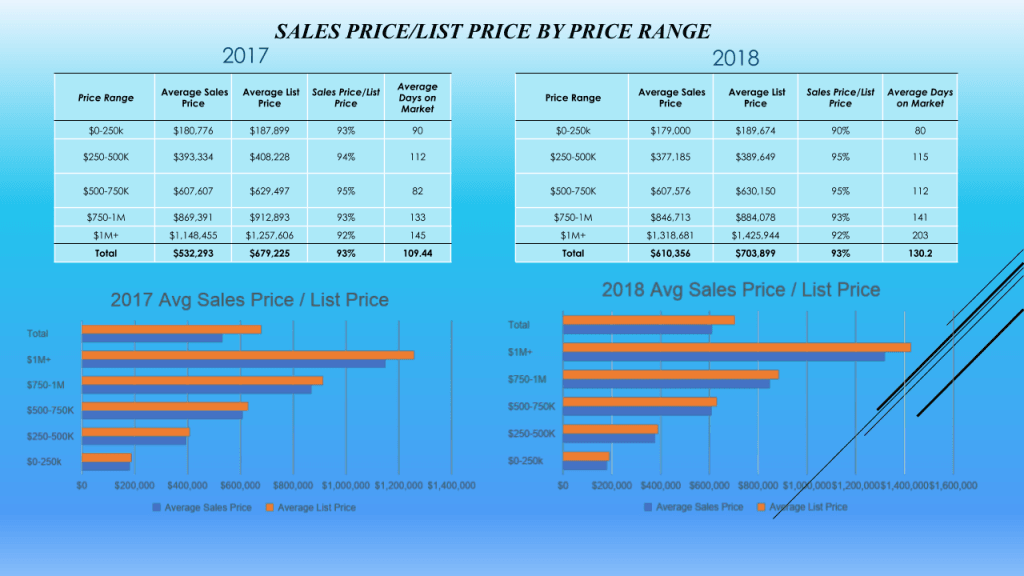
Between 2017 and 2018, sale price/list price averages held mostly steady. There was a slight drop in home sales under $250k from 93% to 90%, but $250k-$500k homes increased by 1% to 95%, and every other bracket maintained their average.
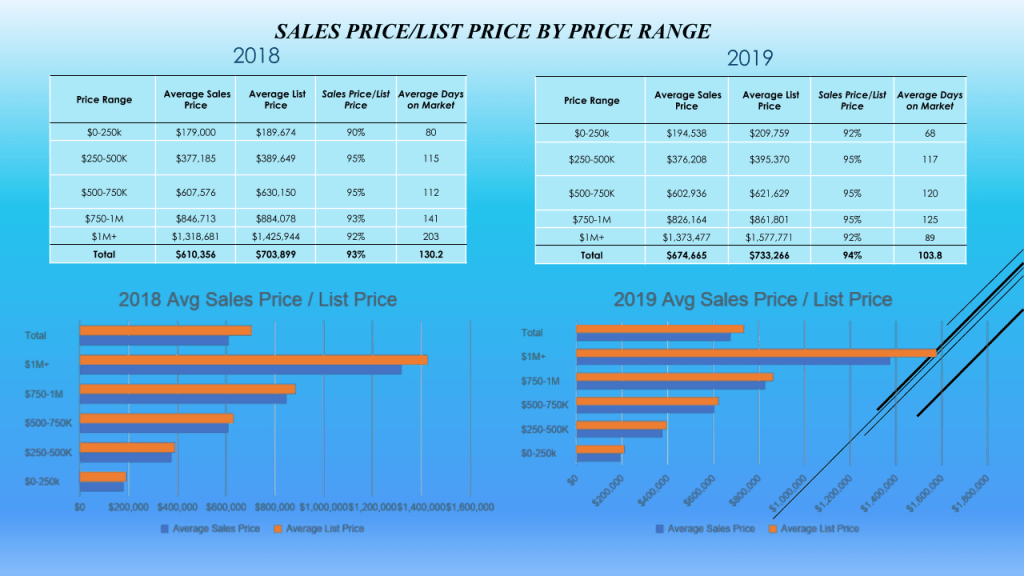
2018 to 2019 averages also held fairly steady, seeing an increase of 2% in both sales under $250k and in the $750k-$1M range. Other brackets remained the same for a total average increase of 1% from 93% to 94%.
Hopefully these metrics are enlightening to you as you choose to move forward with your next real estate venture! If anything is confusing to you, please don’t hesitate to reach out and ask. This is the kind of knowledge I reference in my mind daily, and use to help you make the best decision when buying or selling your dream home!